


IOU BAIS Statistics till Fall 2015
View Here
| Semester | Registered | Admitted | Enrolled |
|---|---|---|---|
| Spring 2010 | 1862 | 559 | 236 |
| Fall 2010 | 3395 | 916 | 451 | Spring 2011 | 3929 | 1516 | 602 |
| Fall 2011 | 4373 | 2346 | 1040 |
| Spring 2012 | 4590 | 2243 | 916 |
| Fall 2012 | 4280 | 2156 | 864 |
| Spring 2013 | 4220 | 2420 | 1075 |
| Fall 2013 | 4862 | 2818 | 1114 |
| Spring 2014 | 3684 | 2613 | 1046 |
| Fall 2014 | 2815 | 1295 | 514 |
| Spring 2015 | 3271 | 969 | 597 |
| Fall 2015 | 2982 | 865 | 565 |
| Total | 42401 | 20157 | 8784 |
| Semester | Admission (of R) | Enrolment (of A) | Enrolment (of R) |
|---|---|---|---|
| Spring 2010 | 30% | 42% | 13% |
| Fall 2010 | 27% | 49% | 13% |
| Spring 2011 | 39% | 40% | 15% |
| Fall 2011 | 54% | 44% | 24% |
| Spring 2012 | 49% | 41% | 40% |
| Fall 2012 | 50% | 40% | 20% |
| Spring 2013 | 57% | 44% | 25% |
| Fall 2013 | 58% | 40% | 23% |
| Spring 2014 | 71% | 40% | 28% |
| Fall 2014 | 46% | 40% | 18% |
| Spring 2015 | 30% | 62% | 18% |
| Fall 2015 | 29% | 65% | 19% |
R – Registrants A - Admissions
Tabulation of Newly Registered, Admitted and Enrolled Students [Spring 2010 – Spring 2014]
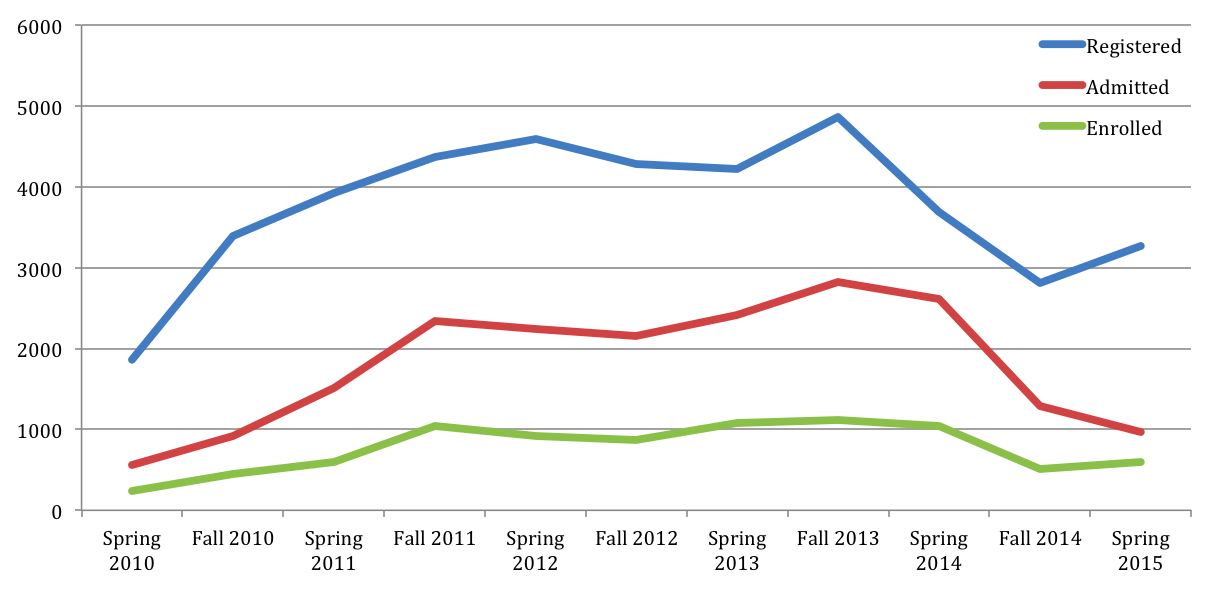
Line Chart Representation of Newly Registered, Admitted and Enrolled Students
(Spring 2010 – Spring 2015)
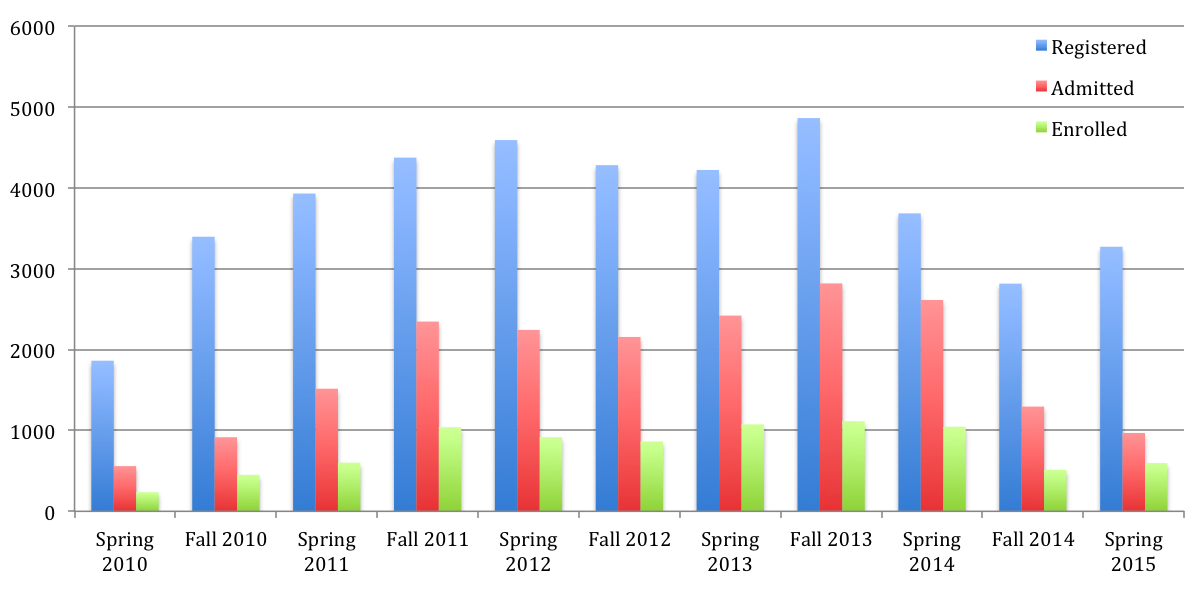
Column Chart Newly Representation of Registered, Admitted and Enrolled Students
(Spring 2010 – Spring 2015)
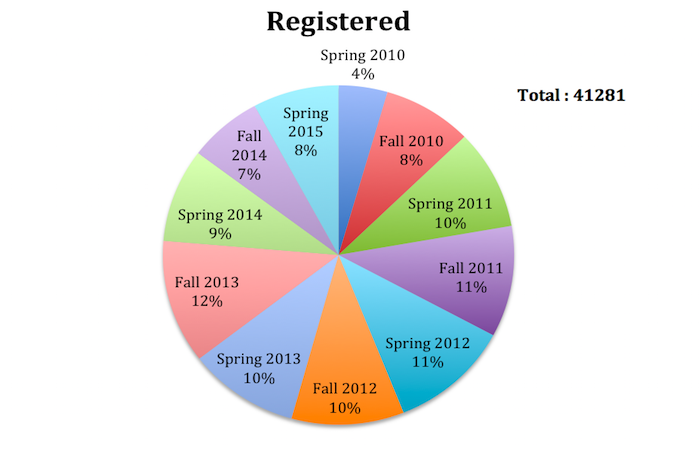
Pie Chart Representation of Total Registered Students (Spring 2010 – Spring 2015)
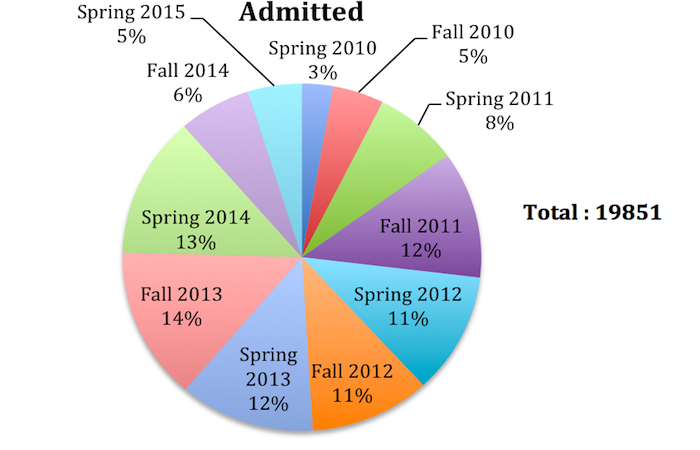
Pie Chart Representation of Total Admitted Students (Spring 2010 – Spring 2015)
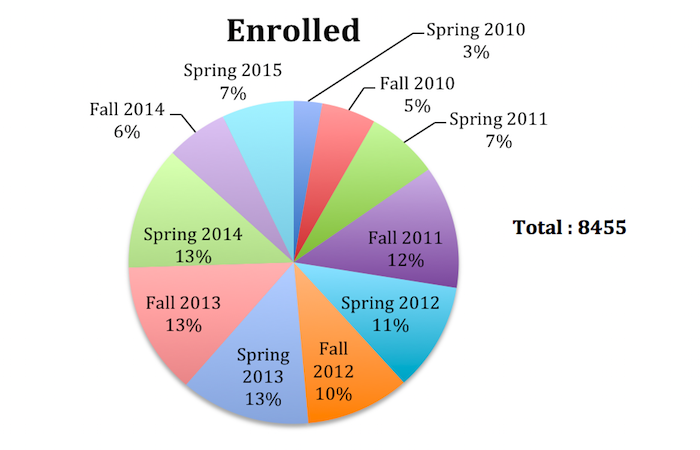
Pie Chart Representation of Total Enrolled Students (Spring 2010 – Spring 2015)
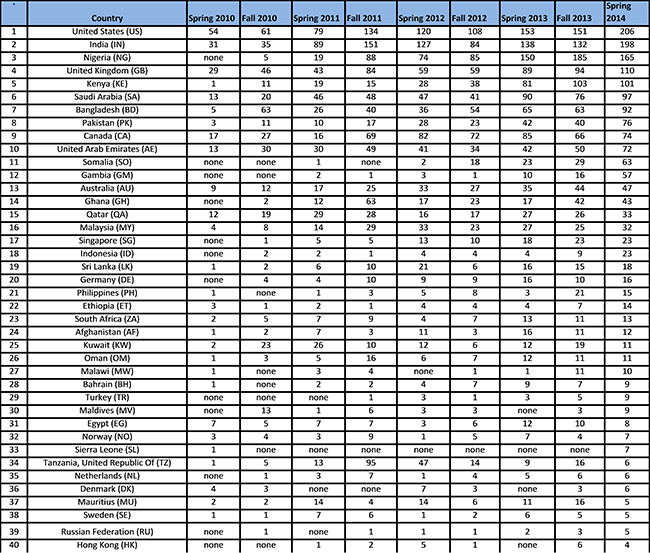
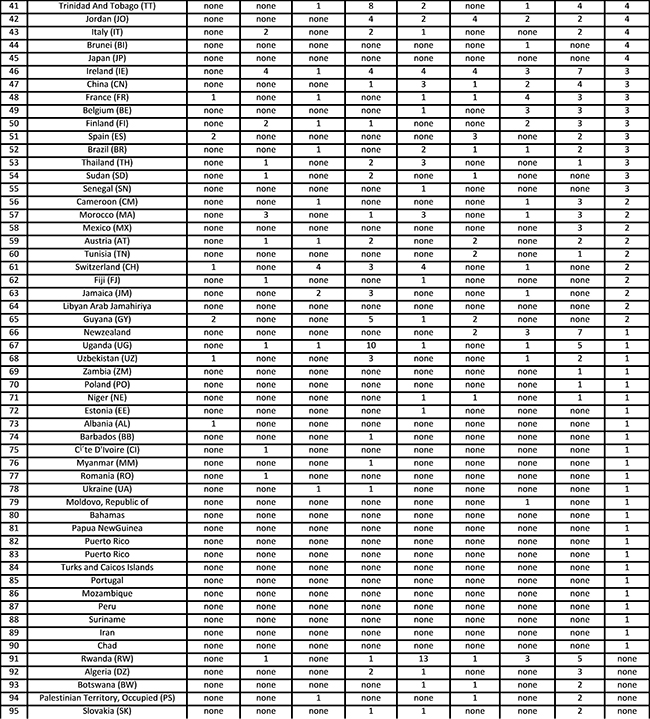
Country wise break down of Enrolled students from Spring 2010 to Spring 2014
IOU Semester wise Statistics
View here
Semester wise Statistics of BSc in Islamic Banking ,Economics and Finance Degree - till Spring 2015
| Semester | Registered | Admitted | Enrolled |
|---|---|---|---|
| Spring 2014 | 483 | 221 | 122 |
| Fall 2014 | 633 | 221 | 116 |
| Spring 2015 | 857 | 332 | 196 |
| Total | 1973 | 774 | 434 |
Tabulation of Registered, Admitted and Enrolled Students of BSC IBE Degree
| Semester | Admission (of R) | Enrolment (of A) | Enrolment (of R) |
|---|---|---|---|
| Spring 2014 | 46% | 55% | 25% |
| Fall 2014 | 35% | 52% | 18% |
| Spring 2015 | 39% | 59% | 23% |
R – Registrants A - Admissions
Semester wise Statistics for BSc in Psychology Degree - till Spring 2015
| Semester | Registered | Admitted | Enrolled |
|---|---|---|---|
| Spring 2014 | 457 | 218 | 124 |
| Fall 2014 | 562 | 225 | 113 |
| Spring 2015 | 670 | 299 | 208 |
| Total | 1689 | 742 | 445 |
Tabulation of Registered, Admitted and Enrolled Students of BSC PSY Degree
| Semester | Admission (of R) | Enrolment (of A) | Enrolment (of R) |
|---|---|---|---|
| Spring 2014 | 48% | 57% | 27% |
| Fall 2014 | 40% | 50% | 20% |
| Spring 2015 | 45% | 70% | 31% |
R – Registrants A - Admissions
Semester wise Statistics for Bachelor of Education Degree - till Spring 2015
| Semester | Registered | Admitted | Enrolled |
|---|---|---|---|
| Spring 2014 | 222 | 91 | 40 |
| Fall 2014 | 318 | 98 | 39 |
| Spring 2015 | 558 | 190 | 106 |
| Total | 1098 | 379 | 185 |
Tabulation of Registered, Admitted and Enrolled Students of B.Ed Degree
| Semester | Admission (of R) | Enrolment (of A) | Enrolment (of R) |
|---|---|---|---|
| Spring 2014 | 41% | 44% | 18% |
| Fall 2014 | 31% | 40% | 12% |
| Spring 2015 | 34% | 56% | 19% |
R – Registrants A - Admissions
Semester wise Statistics for Intensive Arabic Program - till Spring 2014
| Spring 2014 | Total | |
|---|---|---|
| Registered | 731 | 731 |
| Admitted | 653 | 653 |
| Enrolled | 78 | 78 |
Tabulation of Registered, Admitted and Enrolled Students of IAP [Spring 2014]
| Spring 2014 | |
|---|---|
| Admission | 89% of R |
| Enrolment | 12% of A |
| 11% of R |
R – Registrants A - Admissions
IOU Free Diploma Course Section Statistics till 1st April 2017.
View here
Note:
- IOU free Diploma Courses started its operation in April 2007
- Total students registered on the site as on 1st April 2017 is 191942
| Diploma - Number of Students | ||
|---|---|---|
| Year | Number of Students (frequency) |
Number of students (Cummulative Frequency) |
| 2007 (9 months) | 1447 | 1447 |
| 2008 | 4242 | 5689 |
| 2009 | 7741 | 13430 |
| 2010 | 14907 | 28337 |
| 2011 | 20218 | 48556 |
| 2012 | 23123 | 71679 |
| 2013 | 28467 | 100146 |
| 2014 | 28987 | 128714 |
| 2015 | 28033 | 157085 |
| 2016 | 28634 | 185656 |
| 2017(March) | 6321 | 191942 |
Tabular representation of total number of students in General Diploma program
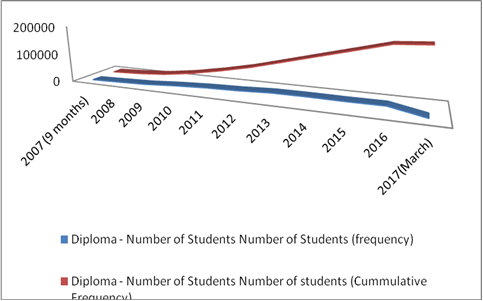
Fig: Line Graph representation of total number of students in General Diploma program
| Top Ten Countries | |
|---|---|
| Country Name | Number of Students |
| United States | 26216 |
| India | 23995 |
| United Kingdom | 19596 |
| Nigeria | 12146 |
| Pakistan | 9386 |
| Canada | 8468 |
| Bangladesh | 8405 |
| Saudi Arabia | 6155 |
| United Arab Emirates | 5894 |
| Malaysia | 5275 |
Fig: Tabular representation of students registered from top 10 countries
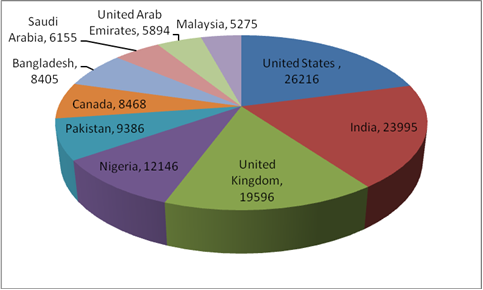
Fig: Pie Chart representation of students registered from top 10 countries
| Months | Year 2013 |
Year 2014 |
Year 2015 |
Year 2016 |
Year 2017 |
Average per month |
|---|---|---|---|---|---|---|
| January | 2747 | 4667 | 3515 | 3678 | 1987 | 3652 |
| February | 2853 | 2314 | 2250 | 2452 | 2010 | 2376 |
| March | 2851 | 2187 | 1853 | 2134 | 2316 | 2268 |
| April | 2265 | 1581 | 4375 | 2127 | 2587 | |
| May | 2124 | 1551 | 1693 | 2571 | 1985 | |
| June | 1964 | 1545 | 1808 | 2617 | 1984 | |
| July | 1728 | 2244 | 1708 | 2218 | 1975 | |
| August | 2343 | 2827 | 3084 | 3651 | 2976 | |
| September | 2597 | 2950 | 2121 | 2695 | 2591 | |
| October | 2174 | 1957 | 2346 | 2418 | 2224 | |
| November | 2540 | 2299 | 1960 | 1646 | 2111 | |
| December | 2275 | 2746 | 1892 | 1661 | 2304 | |
| Average peryear |
2372 | 2406 | 2384 | 2489 | 2104 |
Tabular representation of average per month of students in General Diploma Program
| Months | Year 2013 |
Year 2014 |
Year 2015 |
Year 2016 |
Year 2017 |
Average per month |
|---|---|---|---|---|---|---|
| January | 12 | 4 | 5 | 7 | 3 | 7 |
| February | 5 | 3 | 2 | 5 | 3 | 3.6 |
| March | 4 | 5 | 0 | 1 | 1 | 2.5 |
| April | 6 | 13 | 10 | 5 | 8.9 | |
| May | 8 | 5 | 7 | 10 | 7.5 | |
| June | 7 | 6 | 5 | 0 | 6 | |
| July | 7 | 3 | 4 | 0 | 4.7 | |
| August | 9 | 5 | 6 | 0 | 6.7 | |
| September | 4 | 5 | 0 | 0 | 4.5 | |
| October | 0 | 6 | 9 | 16 | 7.8 | |
| November | 11 | 2 | 4 | 1 | 4.5 | |
| December | 6 | 5 | 0 | 2 | 3.1 | |
| Average peryear |
6.6 | 5.2 | 4.7 | 3.92 |
Tabular representation of average per month of graduates
Total number of countries with their names and the total number of students registered from them.
| Country | Total Number of Students |
|---|---|
| United States | 26239 |
| India | 24030 |
| United Kingdom | 19611 |
| Nigeria | 12178 |
| Pakistan | 9396 |
| Canada | 8472 |
| Bangladesh | 8416 |
| Saudi Arabia | 6157 |
| United Arab Emirates | 5897 |
| Malaysia | 5281 |
| Australia | 5265 |
| Kenya | 4621 |
| Sri Lanka | 3173 |
| Qatar | 2975 |
| Indonesia | 2890 |
| Ghana | 2746 |
| Philippines | 2555 |
| Egypt | 2416 |
| Singapore | 2254 |
| Somalia | 2106 |
| South Africa | 2084 |
| Tanzania, United Republic Of | 1969 |
| 1857 | |
| Maldives | 1726 |
| Ethiopia | 1528 |
| Germany | 1370 |
| Gambia | 1345 |
| Mauritius | 1308 |
| Netherlands | 1165 |
| Afghanistan | 1058 |
| Malawi | 995 |
| Sweden | 935 |
| Kuwait | 867 |
| Turkey | 732 |
| France | 686 |
| Oman | 683 |
| Norway | 683 |
| Trinidad And Tobago | 674 |
| New Zealand | 660 |
| Bahrain | 658 |
| Ireland | 649 |
| Denmark | 513 |
| Uganda | 492 |
| Morocco | 475 |
| Italy | 407 |
| Belgium | 377 |
| China | 353 |
| Spain | 317 |
| Thailand | 311 |
| Sudan | 292 |
| Algeria | 291 |
| Finland | 289 |
| Sierra Leone | 255 |
| Brazil | 249 |
| Jordan | 219 |
| Hong Kong | 215 |
| Russian Federation | 213 |
| Japan | 213 |
| Zimbabwe | 206 |
| Guyana | 205 |
| Tunisia | 199 |
| Bosnia And Herzegovina | 195 |
| Albania | 193 |
| Switzerland | 180 |
| Austria | 176 |
| Brunei Darussalam | 169 |
| Mexico | 155 |
| Myanmar | 141 |
| Poland | 139 |
| Cameroon | 138 |
| Romania | 123 |
| Senegal | 117 |
| Korea, Republic Of | 116 |
| Czech Republic | 114 |
| Jamaica | 103 |
| Palestine, State Of | 102 |
| Ukraine | 101 |
| Fiji | 97 |
| Colombia | 95 |
| Hungary | 92 |
| Kazakhstan | 91 |
| Lebanon | 90 |
| Iraq | 89 |
| Rwanda | 87 |
| Zambia | 84 |
| Yemen | 82 |
| Botswana | 80 |
| Djibouti | 76 |
| Macedonia, The Former Yugoslav Republic Of | 76 |
| Iran, Islamic Republic Of | 74 |
| Syrian Arab Republic | 73 |
| Nepal | 69 |
| Azerbaijan | 69 |
| Niger | 69 |
| Uzbekistan | 64 |
| Georgia | 62 |
| Libya | 56 |
| Serbia | 56 |
| Portugal | 53 |
| Liberia | 51 |
| Cyprus | 50 |
| Argentina | 48 |
| Greece | 44 |
| Slovenia | 44 |
| Mozambique | 42 |
| Lithuania | 41 |
| Côte D'Ivoire | 40 |
| Slovakia | 39 |
| Suriname | 38 |
| Taiwan | 38 |
| Israel | 38 |
| Kyrgyzstan | 34 |
| Guinea | 34 |
| Panama | 33 |
| United States Minor Outlying Islands | 33 |
| American Samoa | 33 |
| Mali | 32 |
| Venezuela, Bolivarian Republic Of | 31 |
| Iceland | 30 |
| Bermuda | 30 |
| Ecuador | 30 |
| Chile | 29 |
| Namibia | 29 |
| Tajikistan | 27 |
| Croatia | 27 |
| Viet Nam | 26 |
| Bahamas | 26 |
| Puerto Rico | 25 |
| Congo, The Democratic Republic Of The | 24 |
| Angola | 24 |
| Cambodia | 23 |
| Peru | 22 |
| Estonia | 22 |
| Montenegro | 21 |
| Mauritania | 21 |
| Luxembourg | 21 |
| Latvia | 20 |
| Seychelles | 20 |
| Dominican Republic | 19 |
| Malta | 19 |
| Bulgaria | 19 |
| Chad | 19 |
| Burundi | 19 |
| Burkina Faso | 18 |
| Barbados | 18 |
| Réunion | 18 |
| South Sudan | 18 |
| Virgin Islands, U.S. | 17 |
| Madagascar | 16 |
| Costa Rica | 16 |
| Benin | 14 |
| Uruguay | 14 |
| Lesotho | 13 |
| Eritrea | 13 |
| Cayman Islands | 12 |
| Togo | 12 |
| Swaziland | 11 |
| Saint Lucia | 11 |
| Dominica | 11 |
| Guatemala | 10 |
| Belarus | 10 |
| Gabon | 10 |
| Comoros | 10 |
| Belize | 9 |
| Korea, Democratic People's Republic Of | 9 |
| Haiti | 8 |
| Isle Of Man | 7 |
| Papua New Guinea | 7 |
| Kiribati | 7 |
| Armenia | 7 |
| El Salvador | 7 |
| Nicaragua | 7 |
| Guinea-Bissau | 6 |
| Macao | 6 |
| Andorra | 6 |
| Guadeloupe | 6 |
| Gibraltar | 6 |
| Honduras | 5 |
| Cuba | 5 |
| Curaçao | 5 |
| Turkmenistan | 5 |
| Ã…land Islands | 5 |
| Aruba | 5 |
| Moldova, Republic Of | 5 |
| Antigua And Barbuda | 4 |
| Timor-Leste | 4 |
| British Indian Ocean Territory | 4 |
| Bolivia, Plurinational State Of | 4 |
| Grenada | 4 |
| Anguilla | 4 |
| Saint Martin (French Part) | 4 |
| Palau | 4 |
| Virgin Islands, British | 3 |
| Cabo Verde | 3 |
| Congo | 3 |
| Vanuatu | 3 |
| Saint Vincent And The Grenadines | 3 |
| Antarctica | 3 |
| Mongolia | 3 |
| 3 | |
| Saint Kitts And Nevis | 3 |
| Jersey | 3 |
| Saint Barthélemy | 2 |
| Christmas Island | 2 |
| Bhutan | 2 |
| Paraguay | 2 |
| Monaco | 2 |
| Martinique | 2 |
| Wallis And Futuna | 2 |
| New Caledonia | 2 |
| Lao People's Democratic Republic | 2 |
| Turks And Caicos Islands | 2 |
| South Georgia And The South Sandwich Islands | 2 |
| Samoa | 2 |
| Pitcairn | 2 |
| Sao Tome And Principe | 2 |
| Saint Helena, Ascension And Tristan Da Cunha | 2 |
| Guernsey | 1 |
| Svalbard And Jan Mayen | 1 |
| Greenland | 1 |
| Micronesia, Federated States Of | 1 |
| Sint Maarten (Dutch Part) | 1 |
| Faroe Islands | 1 |
| Equatorial Guinea | 1 |
| Central African Republic | 1 |
| Guam | 1 |
| Solomon Islands | 1 |
| Niue | 1 |
| Heard Island And Mcdonald Islands | 1 |
| Nauru | 1 |
| Northern Mariana Islands | 1 |
| Liechtenstein | 1 |


